Historical Population Origins
Connections to ancient peoples
Connecting to ancient populations...
Analyzing ancient population connections
Your Genetic Connection to Historical Populations
Discover which populations from across 2000 years of history share your DNA and explore the rich tapestry of cultures that shaped your unique genetic heritage.
Understanding Your Results
Key concepts to help you interpret your genetic ancestry connections
Genetic Similarity
Percentages represent how similar your DNA is to historical reference populations, not exact fractions of ancestry from specific individuals.
Historical Populations (0 CE - 2000 CE)
Results reflect connections to populations across 2000 years of recorded history, from the Roman Empire through to modern times.
Reading the Percentages
Focus on values above 5% for meaningful genetic connections. Values below 2-3% may represent statistical noise or very distant signals.
Genetics vs. Cultural Identity
Genetic ancestry and cultural identity do not always align. Historical migrations, intermarriage, and population movements shape results in unexpected ways.
Unexpected population connections often have fascinating historical explanations. Events like the Roman expansion, Arab conquests, and Mongol migrations created genetic bridges across vast distances. Explore the Historical Context chapter below for the stories behind your results.
Your Ancestry at a Glance
A quick overview of your genetic connections
Eastern European represents your strongest genetic connection at 39%. Your DNA shows meaningful connections to 10 populations across 6 major regions, reflecting 2000 years of human migration, cultural exchange, and historical population movements.
Your Genetic Ancestry Map
Geographic distribution of your ancestral connections
Explore Your Ancestral Regions
Discover the rich history and cultural heritage of the populations that share your DNA
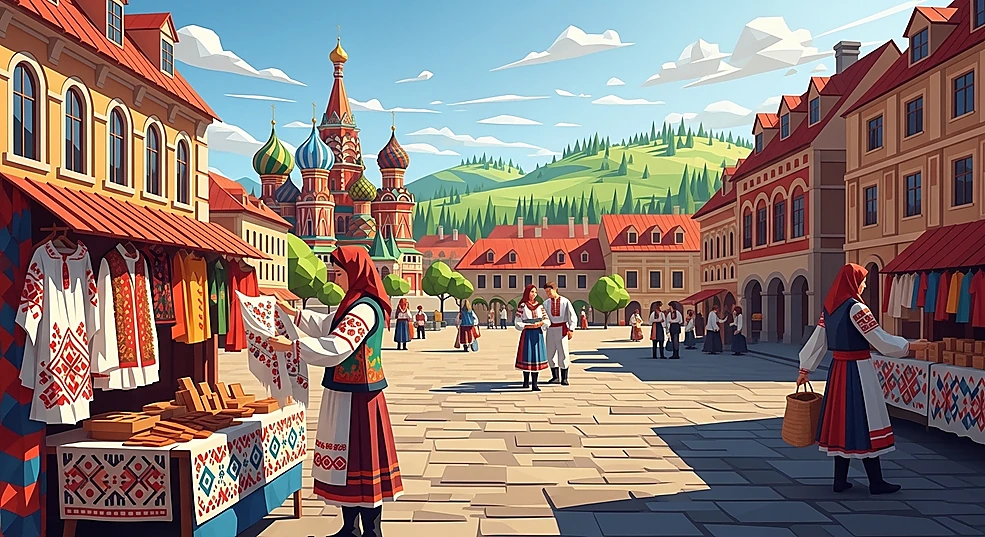
Eastern European
EuropeThe Eastern European region within Europe is historically defined by its position within long-distan ...
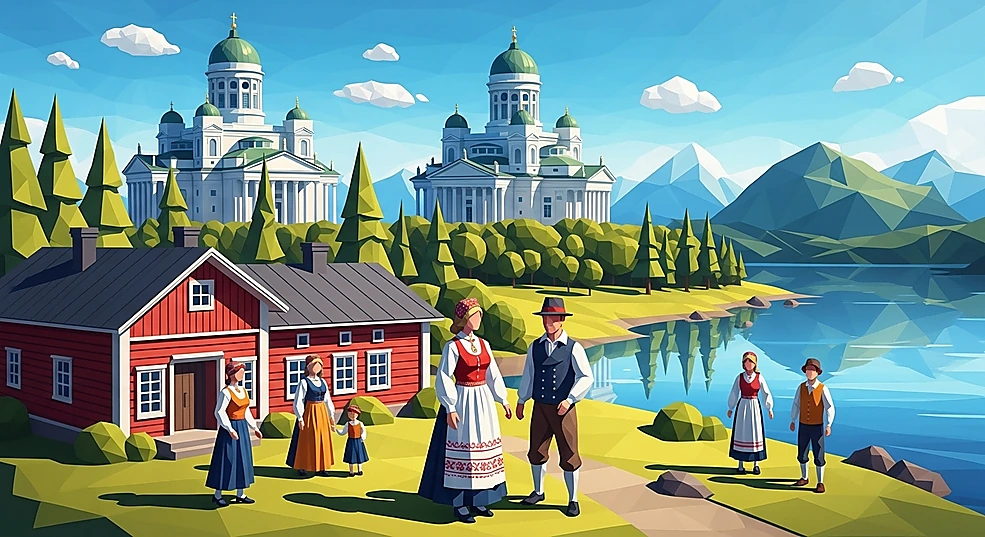
Finnish
EuropeThe Finnish region within Europe is historically defined by its position within long-distance trade, ...
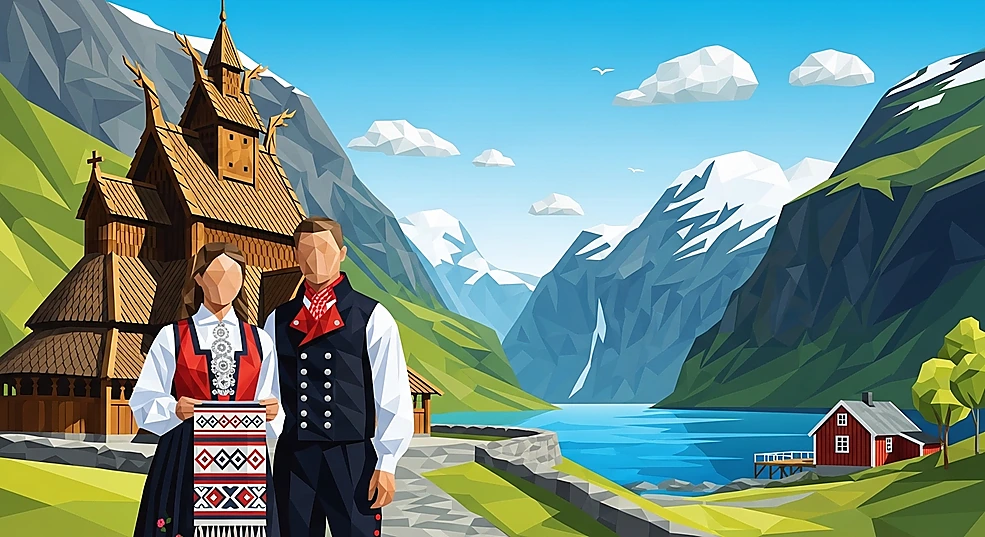
Scandinavian
EuropeThe Scandinavian region within Europe is historically defined by its position within long-distance t ...

English
EuropeThe English region within Europe is historically defined by its position within long-distance trade, ...
Balkan
EuropeThe Balkan region within Europe is historically defined by its position within long-distance trade, ...
Northwestern European
EuropeThe Northwestern European region within Europe is historically defined by its position within long-d ...
South East African
AfricaThe South East African region of Africa is historically defined by its position within long-distance ...
Ethiopian
AfricaThe Ethiopian region within Africa is historically defined by its position within long-distance trad ...
Eastern African
AfricaThe Eastern African region of Africa is historically defined by its position within long-distance tr ...
African Hunter-Gatherer
AfricaThe African Hunter-Gatherer region within Africa is historically defined by its position within long ...
Ghanaian, Liberian, Sierra Leonean
AfricaThe Ghanaian, Liberian, Sierra Leonean region within Africa is historically defined by its position ...

Senegambian & Guinean
AfricaThe Senegambian & Guinean region within Africa is historically defined by its position within long-d ...
Nigerian
AfricaThe Nigerian region within Africa is historically defined by its position within long-distance trade ...
Indian
AsiaThe Indian region within Asia is historically defined by its position within long-distance trade, mi ...
Pakistan
AsiaThe Pakistan region within Asia is historically defined by its position within long-distance trade, ...
Papuan
OceaniaThe Papuan region within Oceania is historically defined by its position within long-distance trade, ...
Historical Context
Key historical events that shaped the populations in your ancestry
Sámi societies of Fennoscandia
Contributed a distinct northern Eurasian-related ancestry component, especially in the far north. Admixture into northern Finns occurred through long-term contact and intermarriage.
Finnic tribal polities (Suomi, Tavastians, Karelians)
Consolidated a Finnic-speaking gene pool through local continuity and regional expansions. Differentiated western and eastern Finnish substructures via founder effects and drift.
Uralic-associated Siberian gene flow into Finland
Spread a Siberian-related component associated with Uralic speakers into Finland via eastern routes. This ancestry is widespread in Finns and higher in the east and north.
Nordic Iron Age Societies
Consolidated a distinct Scandinavian profile with admixture from continental Germanic and Baltic contacts through trade and mobility.
Byzantine Empire (Eastern Roman)
Facilitated Greek- and Anatolian-linked gene flow into Balkan urban centers and coastal zones via garrisons, clergy, and merchants. Intermarriage and resettlement produced localized admixture, especially along the Black Sea.
AI-Powered Analysis
Get personalized insights about your ancestry
AI ASSISTANT by DNAGENICS
This AI analysis is limited to geographical regions and percentage distributions only. No additional data or personal information is included in this analysis.
Try these questions:
Your Heritage Summary
A shareable snapshot of your historical population connections.
Historical Population Origins
DEMO REPORTTop Regions
Science & Methodology
Understanding the science behind your results
Frequently Asked Questions
The Historical Population Origins report analyzes your genetic connections to populations from 0 CE to 2000 CE, the entire Common Era spanning 2000 years of recorded human history. This includes the Roman Empire, Medieval Period, Age of Exploration, and Modern Era.
Percentages represent genetic similarity scores, not exact ancestry fractions. A 30% match means 30% of your genetic markers are similar to that population's profile. Focus on values above 5% for meaningful connections; values under 2-3% may represent statistical noise.
Desktop: Click regions for details, hover for tooltips, scroll to zoom, drag to pan. Mobile: Tap regions for details, pinch to zoom, swipe to pan. Darker colors indicate higher percentages.
Unexpected results often have fascinating historical explanations. Major events like Roman expansion, Arab conquests, Mongol invasions, and European colonization created genetic connections across regions. Small percentages may represent very distant connections or statistical uncertainty.
Genetic ancestry and cultural identity don't always align perfectly. Random genetic inheritance, 2000 years of historical depth, ancient migrations, and undocumented family history all contribute to differences. Your genetic results complement, not replace, family history and cultural identity.
Key limitations include reference population coverage, statistical uncertainty for small percentages, time resolution (2000 years analyzed as a whole), and the distinction between genetic and cultural identity. Results may change as databases expand and methods improve.
How We Calculate Your Results
Analyze hundreds of thousands of genetic markers (SNPs) across your genome
Compare markers to reference populations from 0 CE to 2000 CE
Calculate proportions using maximum likelihood algorithms
Apply quality control filters and generate your personalized report