Contemporary Population Origins
Your modern genetic connections
Connecting to modern populations...
Analyzing modern population connections
Your Genetic Connections to Modern Populations
Discover how your recent ancestors are genetically connected to living populations around the world, reflecting migrations, community bonds, and shared heritage from the last thousand years.
Your Genetic Ancestry Map
Explore your genetic connections to modern populations across different confidence levels
About the Speculative View
This view uses the lowest confidence threshold when assigning ancestry detected in your DNA. It's designed for exploratory analysis and discovering potential connections.
- Exploring deeper ancestry history
- Identifying ancient connections
- Researching overlapping populations
- 20-30+ populations may appear
- Includes distant/uncertain matches
- Some overlapping ancestries
- Percentages above 5%
- Geographic patterns and clusters
- Comparing with other views
At-a-Glance Summary
Quick Insights
- Your results show genetic connections to 3 major population groups
- Explore the interactive map and detailed regional cards below to learn more
- Use the AI Assistant to get personalized interpretations of your results
Please note that the highlighted areas on this map are simply a visual guide and should not be interpreted as exact or definitive ancestry borders.
Explore Your Ancestral Regions
Discover the rich history and cultural heritage of the populations that share your DNA
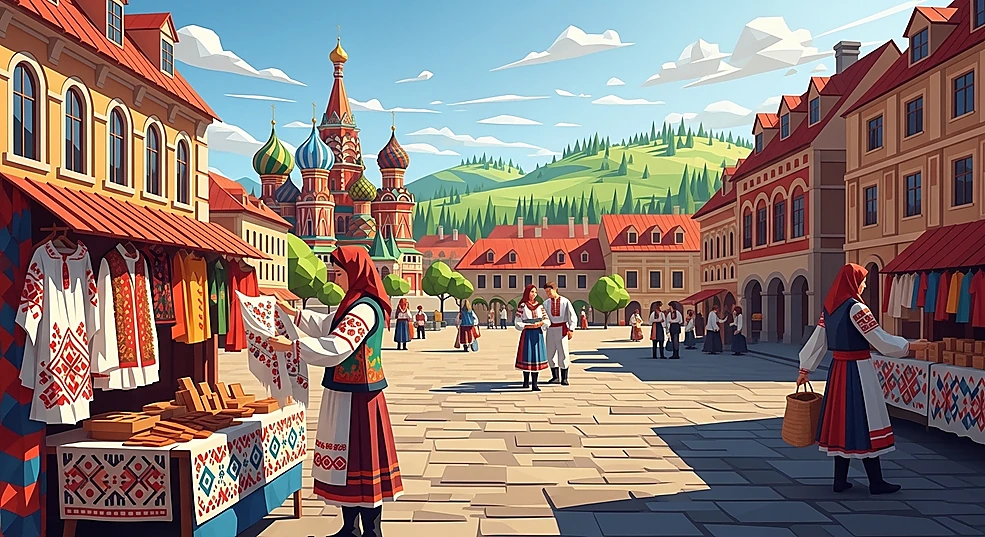
East Slavic
EuropeThe East Slavic region within Europe is historically defined by its position within long-distance tr ...
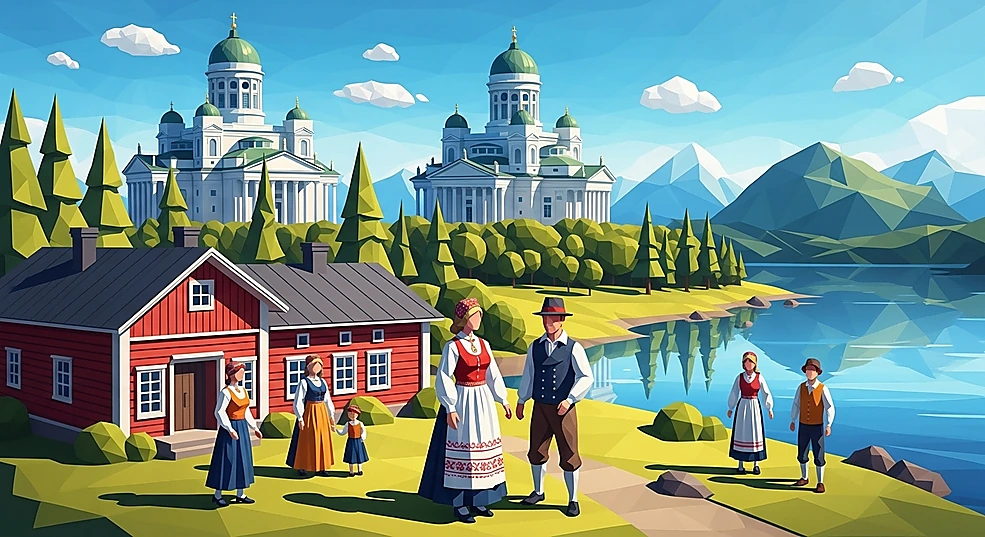
Finnish
EuropeThe Finnish region within Europe is historically defined by its position within long-distance trade, ...
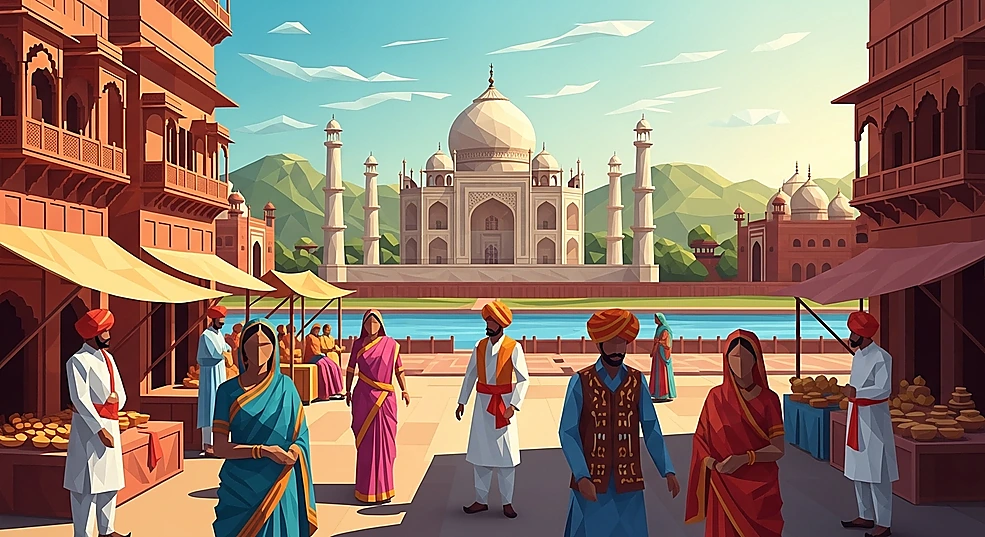
Northern Indian
AsiaThe Northern Indian region within Asia is historically defined by its position within long-distance ...
Broadly African
AfricaThe Broadly African ancestry category represents genetic signals that clearly originate from the Afr ...
AI ASSISTANT by DNAGENICS
This AI analysis is limited to geographical regions and percentage distributions only. No additional data or personal information is included in this analysis.
Try these questions:
About the Intermediate View
This view uses a medium confidence threshold, providing a balanced approach between specificity and coverage. It's ideal for general ancestry exploration.
- Moderate statistical threshold
- Good detail without noise
- Suitable for most users
- 10-20 populations typically
- Mix of certain and possible matches
- Clear regional patterns
- Good starting point for analysis
- Balance between views
- Compare with Conservative
At-a-Glance Summary
Quick Insights
- Your results show genetic connections to 3 major population groups
- Explore the interactive map and detailed regional cards below to learn more
- Use the AI Assistant to get personalized interpretations of your results
Please note that the highlighted areas on this map are simply a visual guide and should not be interpreted as exact or definitive ancestry borders.
Explore Your Ancestral Regions
Discover the rich history and cultural heritage of the populations that share your DNA
West Slavic
EuropeThe West Slavic region within Europe is historically defined by its position within long-distance tr ...
Finnish
EuropeThe Finnish region within Europe is historically defined by its position within long-distance trade, ...
East Slavic
EuropeThe East Slavic region within Europe is historically defined by its position within long-distance tr ...
Northern Indian
AsiaThe Northern Indian region within Asia is historically defined by its position within long-distance ...
Broadly African
AfricaThe Broadly African ancestry category represents genetic signals that clearly originate from the Afr ...
Broadly Oceanian
OceaniaThe Broadly Oceanian ancestry category represents genetic signals originating from the Pacific regio ...
Central American
AmericaThe Central American region within America is historically defined by its position within long-dista ...
Broadly American
AmericaThe Broadly American ancestry category encompasses genetic signals originating from Indigenous peopl ...
AI ASSISTANT by DNAGENICS
This AI analysis is limited to geographical regions and percentage distributions only. No additional data or personal information is included in this analysis.
Try these questions:
About the Conservative View
This view uses the highest confidence threshold, showing only the most certain ancestry assignments. It reflects your closest connections and most recent ancestry.
- Strictest statistical threshold
- Most reliable matches
- Best for family tree verification
- 5-15 populations typically
- Concentrated percentages
- Recent ancestry (2-5 generations)
- Fewer populations = more certainty
- Higher percentages per region
- Direct recent connections
At-a-Glance Summary
Quick Insights
- Your results show genetic connections to 3 major population groups
- Explore the interactive map and detailed regional cards below to learn more
- Use the AI Assistant to get personalized interpretations of your results
Please note that the highlighted areas on this map are simply a visual guide and should not be interpreted as exact or definitive ancestry borders.
Explore Your Ancestral Regions
Discover the rich history and cultural heritage of the populations that share your DNA
West Slavic
EuropeThe West Slavic region within Europe is historically defined by its position within long-distance tr ...
Finnish
EuropeThe Finnish region within Europe is historically defined by its position within long-distance trade, ...
East Slavic
EuropeThe East Slavic region within Europe is historically defined by its position within long-distance tr ...
Broadly African
AfricaThe Broadly African ancestry category represents genetic signals that clearly originate from the Afr ...

Broadly Asian
AsiaThe Broadly Asian ancestry category represents genetic signatures clearly originating from the Asian ...
AI ASSISTANT by DNAGENICS
This AI analysis is limited to geographical regions and percentage distributions only. No additional data or personal information is included in this analysis.
Try these questions:
Understanding Your Results
Key concepts to interpret your genetic ancestry
Genetic Similarity
Percentages show how similar your DNA is to reference populations, not exact ancestry fractions from specific ancestors.
Multiple Confidence Levels
Choose between Speculative, Intermediate, and Conservative views to explore your ancestry at different confidence thresholds.
Modern Populations
Results show connections to present-day populations, reflecting recent ancestry and migrations from the last 1000 years.
Percentage Interpretation
Focus on larger percentages (>5%) for meaningful connections. Small percentages may represent noise or very distant connections.
Start with Conservative
Begin with the Conservative view to see your most recent and confident ancestry connections.
Geographic Proximity
Populations close to each other often share genetic signals due to historical migrations.
Use AI Assistant
Get personalized interpretations of your results with our AI-powered analysis tool.
Modern Heritage Timeline
Key historical events that shaped the contemporary populations in your ancestry
Novgorod Republic and Muscovite influence in Karelia
Brought East Slavic and eastern Finnic inputs into eastern Finland and Karelia. Orthodox networks facilitated admixture across the borderland.
Novgorod Republic
Maritime and riverine trade linked Scandinavia, the Baltic, and the Volga, bringing Scandinavian and Finnic inputs into northern East Slavic populations. Assimilation of local Finnic groups contributed to northern Russian genetic structure.
Ostsiedlung (German Eastward Colonization)
Large-scale arrival of German-speaking settlers reshaped urban and rural demography, adding Central/Northwest European ancestry components. Admixture gradients formed along west–east and town–countryside axes.
Kingdom of Sweden in Finland
Sustained Scandinavian gene flow and social integration across centuries. Swedish-speaking communities and coastal regions show elevated Nordic-related ancestry.
Medieval Swedish coastal colonization of Finland
Established Swedish-speaking settlements that mixed with local Finns. Scandinavian ancestry increased along coasts and archipelagos.
Technical Details & FAQs
Understanding the science behind your results
Contemporary Population Origins is our analysis that shows how your DNA connects to modern populations living today or in recent history. Unlike ancient DNA tests that look at archaeological samples from Bronze Age or earlier, this report focuses on the last 1000 years of human history.
The term "contemporary" means we're comparing your DNA to reference populations that exist now or existed in recent historical times. This helps you understand which modern ethnic groups and geographic regions share the most genetic similarity with you.
Modern ancestry analyzes your genetic similarity to present-day populations, while ancient ancestry compares your DNA to archaeological samples from thousands of years ago. Modern ancestry reflects more recent migrations and population movements, typically within the last 1000 years.
The percentages represent genetic similarity scores, not exact ancestry fractions. A 25% match to a population doesn't mean you have exactly one grandparent from that group, but rather that 25% of your genetic markers are similar to that population's typical patterns.
Focus on larger percentages (>5%) and patterns across regions rather than exact numbers. Compare all three confidence levels to understand the certainty of your matches.
We provide three confidence levels:
- Speculative: Shows all detected ancestry, including distant or uncertain connections. May show 20-30+ populations.
- Intermediate: Balances specificity with coverage. Typically shows 10-20 populations.
- Conservative: Shows only the most confident ancestry assignments. Usually displays 5-15 populations.
Genetic ancestry and cultural/family history don't always align perfectly. This is normal and expected due to:
- Random inheritance: You inherit roughly 50% from each parent, but specific segments vary.
- Historical migrations: Your DNA may carry signatures from migrations before recorded family history.
- Cultural vs genetic identity: Cultural identity is shaped by many non-genetic factors.
While our analysis is based on cutting-edge genetic research, it's important to understand:
- Reference population coverage varies by region
- Small percentages (<3%) may not be statistically significant
- Results may change as databases improve
- Genetic ancestry ? cultural or ethnic identity
Methodology Overview
Statistical Methods
We employ admixture analysis, a well-established statistical approach that models your DNA as a mixture of contributions from different reference populations. The algorithm analyzes hundreds of thousands of genetic markers across your genome.
Reference Population Database
Our analysis uses a curated database of genetic profiles from populations worldwide, including modern samples from living individuals and recent historical samples where available.
Confidence Threshold Calculation
The three confidence levels represent different statistical stringency. Conservative uses the highest threshold requiring strong evidence, Intermediate uses moderate threshold, and Speculative uses lower threshold for detecting weaker signals.
Quality Metrics
We assess analysis quality through coverage percentage (typically >98%), call rate, reference match quality, and internal cross-validation. Average accuracy for Conservative view assignments is >90% for well-represented ancestry.
Your Heritage Summary
A shareable snapshot of your modern population alignment
Shared Modern Origins
DEMO REPORTTop Ancestry Regions
AI Infographic
Turn your modern population ancestry breakdown into a shareable vertical infographic. Uses the same AI image credits as G25 Studio.