Zum Hauptinhalt springen
mtDNA · Mütterliche Linie

M

mtDNA Haplogroup M

Ein Referenzprofil für einen Abstammungszweig. Gemeinsame Haplogruppen begründen weder eine familiäre Beziehung noch eine kulturelle Identität.

Referenzprofil

Hintergrund des Zweigs

Historischer Kontext für den mtDNA-Abstammungszweig M

Origins and Evolution

mtDNA haplogroup M is a primary non-African maternal lineage that branches from African-derived haplogroup L3 shortly after the Out-of-Africa dispersal. Most population-genetic and phylogenetic analyses place the origin of M roughly between 50–70 kya, with many estimates clustering around ~55–65 kya, consistent with an early Upper Paleolithic coastal or near-coastal expansion into South and Southeast Asia. M diversified rapidly into numerous regional sublineages as modern humans spread across Asia and into Oceania.

Subclades

Haplogroup M contains many major downstream clades that have distinct geographic and historical signatures. Important descendant lineages include (but are not limited to): C, D, E, G, Z, M1, F-derived clusters, and numerous South and Southeast Asian-specific M branches. Some of these (e.g., C and D) are prominent in northern Eurasia and the Americas, whereas M1 is notable for its presence in North Africa and is generally interpreted as a Paleolithic back-migration into Africa. Other M subclades are highly diverse and endemic to South Asia, the Andaman Islands, Island Southeast Asia, and Near Oceania.

Geographical Distribution

Haplogroup M and its derivatives are widespread across Asia and Oceania with varying frequencies: very high diversity and frequency in South Asia and parts of Southeast Asia, high frequencies in many indigenous populations of Oceania (including Papuans and Aboriginal Australians), substantial representation across East Asia (through certain M subclades), and presence in the Americas through descendant clades (notably C and D). A localized presence of M1 in North Africa reflects prehistoric back-migration events. In western Eurasia M is generally rare except for specific regional introductions and recent gene flow.

Historical and Cultural Significance

Because M diversified early after the Out-of-Africa dispersal, it marks some of the earliest human expansions into South and Southeast Asia and the colonization of Near Oceania and Australia. Several M subclades trace migrations associated with the coastal dispersal model, and later M lineages were carried during the Austronesian expansion into Island Southeast Asia and Oceania. The presence of M-derived lineages (C and D) among Native American populations also links M to the founding maternal ancestry of many indigenous peoples of the Americas.

Conclusion

mtDNA haplogroup M is a foundational non-African maternal lineage whose deep time depth and widespread diversification make it central to reconstructing early modern human migrations across Asia, Oceania, and into the Americas. Its many regional subclades record both Pleistocene dispersals and later Holocene demographic events, and continued sampling and ancient DNA studies keep refining its internal phylogeny and geographic history.

Wichtige Punkte

  • Origins and Evolution
  • Subclades
  • Geographical Distribution
  • Historical and Cultural Significance
  • Conclusion

Referenzprofil

Baum und Verwandtschaft

Phylogenetischer Kontext und Subkladen

Entwicklungsweg

Folgen Sie den erfassten übergeordneten Zweigen bis M. Die Daten sind Schätzungen und können sich ändern, wenn Referenzdaten überarbeitet werden.

Schritte Haplogruppe Altersschätzung Archäologische Epoche Vergangene Zeit Unmittelbare Nachkommen Getestete moderne Nachkommen Antike Verknüpfungen
1 M Aktuell ~60,000 years ago Paleolithic 60,000 Jahre 42 2,671 41
2 L3 ~70,000 years ago Paleolithic 70,000 Jahre 7 30,162 6
3 L3'4 - - - 2 30,212 0
4 L3'4'6 - - - 2 30,216 0
5 L2'3'4'6 - - - 2 31,333 0
6 L2'3'4'5'6'7 - - - 2 31,349 0
7 L1'2'3'4'5'6'7 - - - 2 31,852 0
8 L ~160,000 years ago Paleolithic 160,000 Jahre 2 32,236 5

Geschwisterzweige (6)

Weitere Zweige derselben übergeordneten Haplogruppe

Referenzprofil

Verbreitung weltweit

Geografische Verbreitung und moderne Präsenz

Erfasster Ursprung

South or Southeast Asia

Moderne Verbreitung

The populations where mtDNA haplogroup M is found include:

  1. Indigenous Australians (Aboriginal groups)
  2. Papuan and Melanesian populations
  3. Andaman Islanders (Onge, Jarawa and related groups)
  4. South Asian populations (Dravidian and Indo-Aryan groups across India, Pakistan, Sri Lanka)
  5. East Asian populations (Han Chinese, Japanese, Korean and other East Asian groups via specific M subclades)
  6. Southeast Asian populations (Austroasiatic, Tai-Kadai, Austronesian groups)
  7. Native American groups (founding lineages such as haplogroups C and D derived from M)
  8. Central Asian and Siberian populations (various M-derived clades)
  9. North African populations (primarily M1 in Berber, Egyptian and neighboring groups)
  10. Himalayan/Tibetan and highland populations of South-Central Asia
Historischer Kontext

Ein Zweig durch die Zeit

Geschätzte Entstehung in einer breiten historischen Zeitleiste. Zeitmarken liefern Kontext und implizieren keine Verbindung zu bestimmten Kulturen.

  1. ~70k Jahre zurück

    Ausbreitung aus Afrika

    Wichtige Wanderungsbewegung moderner Menschen aus Afrika

  2. ~60k Jahre zurück

    Haplogruppe M

    Geschätzte Entstehung dieses mtDNA-Zweigs; Daten und Orte sind Referenzschätzungen.

    Dieser Zweig
  3. ~50k Jahre zurück

    Jungpaläolithikum

    Fortgeschrittene Werkzeuge, Kunst und kulturelle Vielfalt

  4. ~20k Jahre zurück

    Letztes glaziales Maximum

    Höhepunkt der letzten Eiszeit, isolierte Bevölkerungen

  5. ~10k Jahre zurück

    Neolithische Revolution

    Beginn der Landwirtschaft und feste Siedlungen

  6. ~5k Jahre zurück

    Bronzezeit

    Metallverarbeitung, Schrift und frühe Zivilisationen

  7. ~3k Jahre zurück

    Eisenzeit

    Eisenwerkzeuge und ausgedehnte Handelsnetze

  8. ~2.5k Jahre zurück

    Klassische Antike

    Blüte griechischer und römischer Kulturen

  9. Gegenwart

    Gegenwart

    Moderne Zeit

Referenzprofil

Archäologischer Kontext

Erfasste archäologische Zuordnungen für den mtDNA-Zweig M

Erfasste Zuordnungen

Diese Bezeichnungen beschreiben archäologische Kontexte erfasster Referenzproben mit Bezug zu M. Eine Zuordnung bedeutet nicht, dass alle Träger einer Kultur angehörten oder einer bestimmten Migrationsroute folgten.

Andamanese British Neolithic Goyet Cave Gravettian Katelai Culture Ostuni Culture Spanish Gravettian Udegram Culture Unai Culture
Kulturzuordnungen basieren auf dem archäologischen Kontext antiker DNA-Proben und können regionale Verknüpfungen in bestimmten Zeiträumen widerspiegeln.
Referenzprofil

Probencatalog

13 direkte Träger und 28 Subkladen-Träger der Haplogruppe M

10 angezeigt · 41 passende Proben

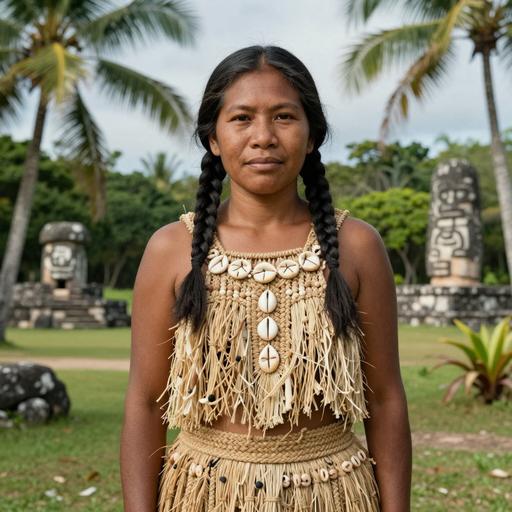
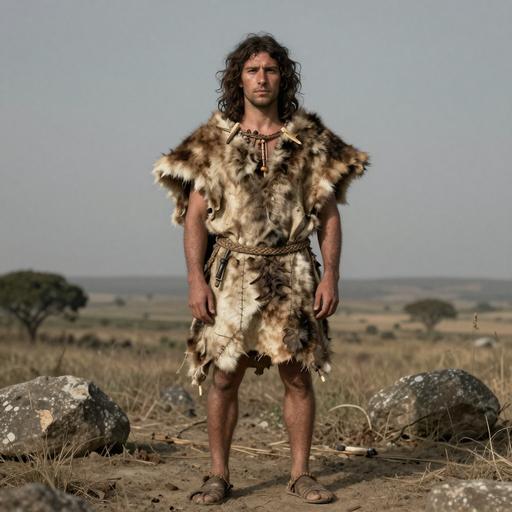
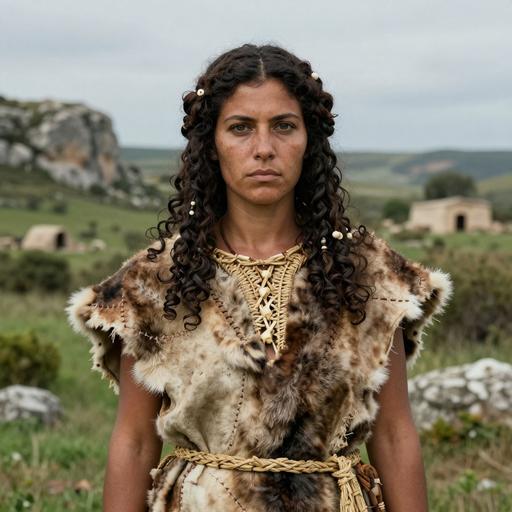
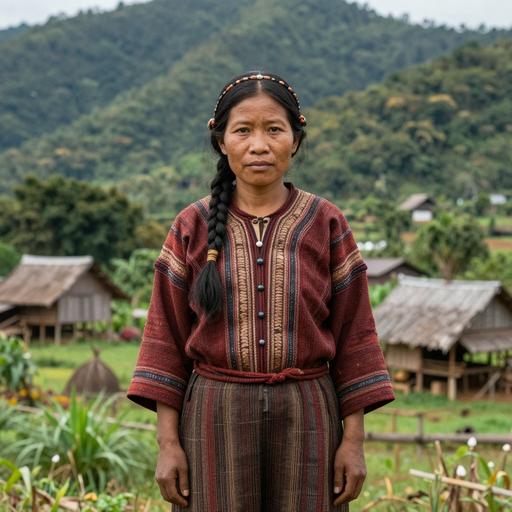
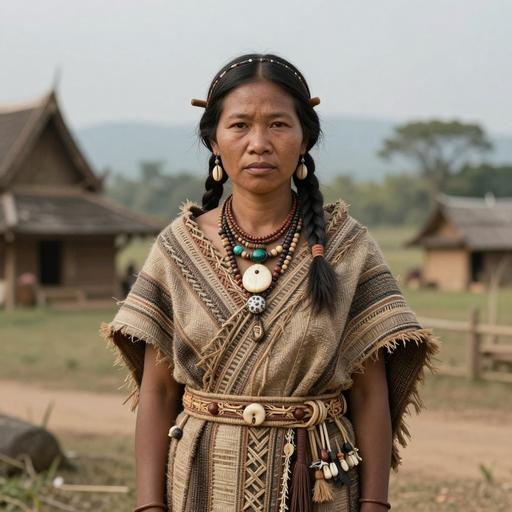
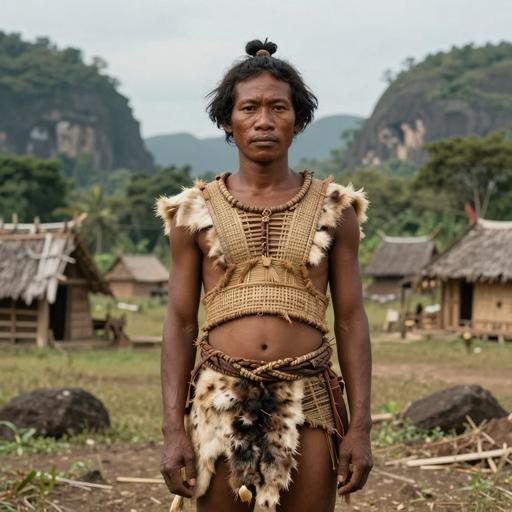
Porträts sind KI-generierte Illustrationen. Probenbezeichnungen und Zugangs-IDs identifizieren die Referenzdatensätze.

Porträt Probe Land Epoche Datum Kultur mtDNA Übereinstimmung
KI-generiertes illustratives Porträt von Lazio Imperial Roman Roman-o Anatolia Caucasus individual, ANAS (Azienda Nazionale Autonoma delle Strada), Italy (100-300 CE)

Proben-ID: R67
Italy Imperial Rome 100-300 CE Roman Empire M Direkt
KI-generiertes illustratives Porträt von Orenburg Early Sarmatian individual, Pokrovka, Russia (400-200 BCE)
Proben-ID: I0575
Russia Iron Age Early Sarmatian, Russia 400-200 BCE Early Sarmatian Culture M Direkt
KI-generiertes illustratives Porträt von Southeast Asian Civilizations individual, Ban Chiang, Thailand (777-547 BCE)
Proben-ID: I4458
Thailand Thailand BA 777 BCE - 547 BCE Thai Bronze Age M Direkt
KI-generiertes illustratives Porträt von Thailand Ba individual, Ban Chiang, Thailand (777-547 BCE)
Proben-ID: I4458
Thailand Thailand BA 777 BCE - 547 BCE Thai Bronze Age M Direkt
KI-generiertes illustratives Porträt von Pre Latte Period Late Unai individual, Guam. Naton Beach Site, Guam (791-555 BCE)
Proben-ID: I18447
Guam Guam LateUnai 791-555 calBCE (2535±20 BP, PSUAMS-8976) Unai Culture M Direkt
KI-generiertes illustratives Porträt von IA individual, Swat Valley. Katelai, Pakistan (1,000-800 BCE)
Proben-ID: I12444
Pakistan The Pakistan Katelai Iron Age Culture 1000-800 BCE Katelai Culture M Direkt
KI-generiertes illustratives Porträt von IA individual, Swat Valley. Udegram, Pakistan (1,107-913 BCE)
Proben-ID: I1985
Pakistan Udegram Iron Age Fortified Settlement in Swat Valley, Pakistan 1107-913 calBCE (2837±25 BP) [R_combine: (2880±30 BP, Beta-428667), (2758±40 BP, CEDAD-LTL13334A)] Udegram Culture M Direkt
KI-generiertes illustratives Porträt von Gravettian individual, Mollet III (Catalonia, Girona, Serinyà), Spain (25,372-25,126 BCE)
Proben-ID: GER003
Spain Spain Gravettian 25372-25126 calBCE (22860±80 BP, ETH-66710) Spanish Gravettian M Direkt
KI-generiertes illustratives Porträt von Apulia Gravettian individual, Apulia. Ostuni, Italy (25,860-25,426 BCE)
Proben-ID: Ostuni1
Italy Ostuni 1 Hunter-Gatherer, Southern Italy 25860-25426 calBCE (23446±107 BP, MAMS-11449) Ostuni Culture M Direkt
KI-generiertes illustratives Porträt von Pre-civilization individual, Fournol (Occitanie Region, Lot Department), France (27,074-26,501 BCE)
Proben-ID: FRL006
France France Gravettian 27074 BCE - 26501 BCE Gravettian M Direkt
MATERNAL LINEAGE · ANCIENT DNA

Ancient lineage evidence map

Follow parent clades toward this branch and explore where ancient carriers were found.

Loading ancient observations…

Markers are archaeological find locations. A dashed connector is an uncertain, proposed geographic transition between consecutive branches supported by multiple dated observations; it is not an exact travel route, birthplace or proof of direct descent. Parent-clade samples may belong to other descendant branches. Gaps remain where evidence is insufficient. Sample dates differ from haplogroup formation dates.

Referenzprofil

Trägerverteilungskarte

Geografische Verteilung von 41 antiken DNA-Proben (direkte und Subkladen-Träger von M)

Direkter Träger Subkladen-Träger
Zeitraumfilter
Alle Zeiträume
Alle Proben werden angezeigt
Referenzprofil

Zeitliche Verteilung

Verteilung der Träger über archäologische Epochen

Referenzprofil

Geografische Verteilung

Anzahlen nach erfasstem Probenland. Sie spiegeln die verfügbare Referenzauswahl wider, nicht Bevölkerungshäufigkeiten.

Referenzprofil

Verteilung Land × Epoche

Vergleichen Sie erfasste Probenanzahlen nach Ländern und archäologischen Epochen. Wählen Sie eine belegte Zelle, um eine Probe anzusehen.

Daten

Daten und Herkunft

Quellenangaben und Datenqualität

Zuletzt aktualisiert 2026-02-09

Datenquelle

Klassifikation, geschätzte Daten und geografischer Kontext spiegeln die erfassten Referenzdaten wider und können sich bei überarbeiteten Belegen ändern. Die Probenabdeckung ist ungleichmäßig; erfasste Orte und archäologische Zuordnungen begründen weder persönliche Herkunft noch kulturelle Identität.