Zum Hauptinhalt springen
mtDNA · Mütterliche Linie

M13

mtDNA Haplogroup M13

Ein Referenzprofil für einen Abstammungszweig. Gemeinsame Haplogruppen begründen weder eine familiäre Beziehung noch eine kulturelle Identität.

Referenzprofil

Hintergrund des Zweigs

Historischer Kontext für den mtDNA-Abstammungszweig M13

Origins and Evolution

Haplogroup M13 sits within the larger macro-haplogroup M, a major branch of the non-African mitochondrial phylogeny that diversified rapidly after the Out-of-Africa dispersal. Given its position under the intermediate node M13'46'61, M13 most likely represents an early Paleolithic split of M that occurred as modern humans expanded across South and Southeast Asia. Coalescence time estimates for many M subclades typically fall in the range of ~40–60 kya; based on phylogenetic position and comparative age estimates for sibling clades, a plausible origin for M13 is in the Upper Paleolithic (on the order of 40–50 kya), although precise dating requires more sequence-based calibration and broader sampling.

Because M13 is a relatively rare and understudied lineage in many published datasets, interpretations of its internal structure and demographic history remain provisional. Ancient DNA sampling and expanded modern population surveys are necessary to refine timing and geography.

Subclades

As an intermediate clade within the M13'46'61 grouping, M13 may include downstream subclades identified in detailed mitogenome studies, but many of these remain sparsely sampled or are defined only by limited control-region variants in older studies. Known sister branches under the same parent (for example M46 and M61) help place M13 within a cluster of early M diversification across South and Southeast Asia. Where full mitochondrial genomes have been obtained, subclade definition improves; however, for M13 specifically, many putative subclades require further confirmation with complete mitogenomes.

Geographical Distribution

Based on available population genetics studies and reasonable phylogeographic inference, M13 is most reliably reported at low to moderate frequencies in parts of South Asia and at low frequencies across island Southeast Asia and Near Oceania. Scattered reports — often at very low frequency — exist in other regions, which can reflect ancient dispersals or more recent gene flow. Sampling bias (unequal sampling of indigenous and rural groups) and limited mitogenome resolution in some studies mean that apparent absences in some areas may simply reflect lack of data rather than true absence.

Key points about distribution:

  • Core signal: Likely centered in South or nearby regions of Southeast Asia where early M diversification is richest.
  • Island Southeast Asia / Near Oceania: Low-frequency occurrences may reflect ancient coastal dispersals or later maritime movements (including Austronesian-era gene flow) in some island populations.
  • Scattered occurrences: Occasional reports outside these regions can reflect long-distance dispersal, historic trade networks, or later migrations.

Historical and Cultural Significance

Because M13 is deep-rooted and generally rare, its most significant contribution is as a marker of early maternal diversification in South/Southeast Asia rather than being tied to a single archaeological culture. Interpretations in cultural terms are therefore cautious:

  • Paleolithic hunter-gatherer context: The origin timing places M13 within the Upper Paleolithic hunter-gatherer phase of human prehistory in South/Southeast Asia.
  • Neolithic and later periods: Low-frequency presence in some island and coastal populations means M13 could have been carried along coastal migration routes and later influenced by Neolithic farmer expansions and Austronesian movements; however, it is not a dominant Neolithic marker like some haplogroups associated strongly with farming expansions.
  • Modern population structure: In contemporary genetic surveys, M13 provides information about local maternal ancestry and deep regional continuity when observed in indigenous or isolated groups.

Conclusion

mtDNA M13 is best understood as a rare, ancient maternal lineage within macro-haplogroup M that likely arose in South or Southeast Asia in the Upper Paleolithic and persisted at low to moderate frequencies in the region. Its full phylogenetic complexity and precise prehistoric movements remain incompletely resolved due to limited sampling and mitogenome data; targeted whole-mitochondrial sequencing across understudied populations and integration with ancient DNA will clarify its subclades, age, and geographic history.

Wichtige Punkte

  • Origins and Evolution
  • Subclades
  • Geographical Distribution
  • Historical and Cultural Significance
  • Conclusion
Referenzprofil

Baum und Verwandtschaft

Phylogenetischer Kontext und Subkladen

Entwicklungsweg

Folgen Sie den erfassten übergeordneten Zweigen bis M13. Die Daten sind Schätzungen und können sich ändern, wenn Referenzdaten überarbeitet werden.

Schritte Haplogruppe Altersschätzung Archäologische Epoche Vergangene Zeit Unmittelbare Nachkommen Getestete moderne Nachkommen Antike Verknüpfungen
1 M13 Aktuell ~45,000 years ago Paleolithic 45,000 Jahre 2 6 0
2 M13'46'61 - - - 1 9 0
3 M ~60,000 years ago Paleolithic 60,000 Jahre 42 2,671 41
4 L3 ~70,000 years ago Paleolithic 70,000 Jahre 7 30,162 6
5 L3'4 - - - 2 30,212 0
6 L3'4'6 - - - 2 30,216 0
7 L2'3'4'6 - - - 2 31,333 0
8 L2'3'4'5'6'7 - - - 2 31,349 0
9 L1'2'3'4'5'6'7 - - - 2 31,852 0
10 L ~160,000 years ago Paleolithic 160,000 Jahre 2 32,236 5
Referenzprofil

Verbreitung weltweit

Geografische Verbreitung und moderne Präsenz

Erfasster Ursprung

South or Southeast Asia

Moderne Verbreitung

The populations where mtDNA haplogroup M13 is found include:

  1. Various South Asian populations (including some tribal and rural groups in the Indian subcontinent)
  2. Island and coastal populations of Southeast Asia (Indonesia, Philippines and nearby archipelagos) reported at low frequency
  3. Austronesian-speaking groups in Madagascar and parts of the Indian Ocean rim in isolated cases
  4. Near Oceanian and Melanesian groups at low frequency in some surveys (potentially reflecting ancient coastal dispersals)
  5. Occasional, low-frequency reports in East African coastal populations, likely reflecting historical or recent gene flow
Historischer Kontext

Ein Zweig durch die Zeit

Geschätzte Entstehung in einer breiten historischen Zeitleiste. Zeitmarken liefern Kontext und implizieren keine Verbindung zu bestimmten Kulturen.

  1. ~50k Jahre zurück

    Jungpaläolithikum

    Fortgeschrittene Werkzeuge, Kunst und kulturelle Vielfalt

  2. ~45k Jahre zurück

    Haplogruppe M13

    Geschätzte Entstehung dieses mtDNA-Zweigs; Daten und Orte sind Referenzschätzungen.

    Dieser Zweig
  3. ~20k Jahre zurück

    Letztes glaziales Maximum

    Höhepunkt der letzten Eiszeit, isolierte Bevölkerungen

  4. ~10k Jahre zurück

    Neolithische Revolution

    Beginn der Landwirtschaft und feste Siedlungen

  5. ~5k Jahre zurück

    Bronzezeit

    Metallverarbeitung, Schrift und frühe Zivilisationen

  6. ~3k Jahre zurück

    Eisenzeit

    Eisenwerkzeuge und ausgedehnte Handelsnetze

  7. ~2.5k Jahre zurück

    Klassische Antike

    Blüte griechischer und römischer Kulturen

  8. Gegenwart

    Gegenwart

    Moderne Zeit

Referenzprofil

Archäologischer Kontext

Erfasste archäologische Zuordnungen für den mtDNA-Zweig M13

Erfasste Zuordnungen

Diese Bezeichnungen beschreiben archäologische Kontexte erfasster Referenzproben mit Bezug zu M13. Eine Zuordnung bedeutet nicht, dass alle Träger einer Kultur angehörten oder einer bestimmten Migrationsroute folgten.

British Neolithic Goyet Cave Gravettian Iberomaurusian Indonesian Hunter-Gatherer Culture Malaysian Neolithic Ostuni Culture Spanish Gravettian Vietnamese Neolithic
Kulturzuordnungen basieren auf dem archäologischen Kontext antiker DNA-Proben und können regionale Verknüpfungen in bestimmten Zeiträumen widerspiegeln.
Referenzprofil

Probencatalog

7 Subkladen-Träger der Haplogruppe M13 (keine direkten Träger in der aktuellen Referenzauswahl)

7 angezeigt · 7 passende Proben

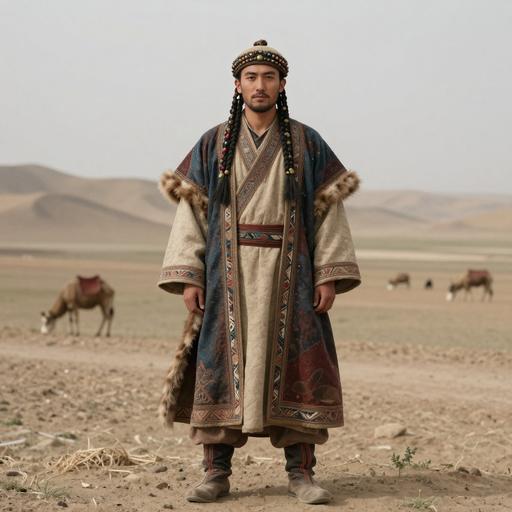
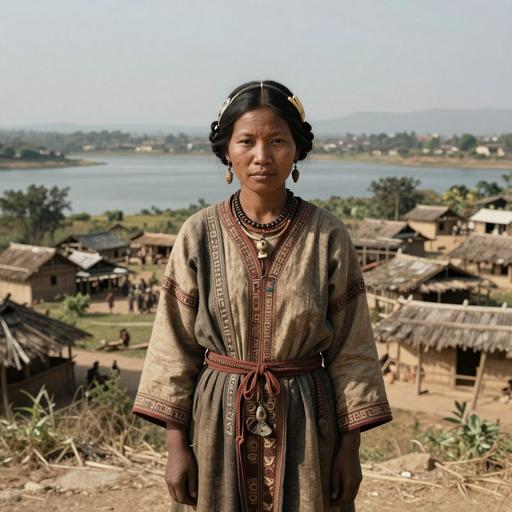
Porträts sind KI-generierte Illustrationen. Probenbezeichnungen und Zugangs-IDs identifizieren die Referenzdatensätze.

Porträt Probe Land Epoche Datum Kultur mtDNA Übereinstimmung
KI-generiertes illustratives Porträt von Xinjiang Xikakandasayi Historical individual, Xinjiang. Bayinguoleng(Bayingolin) Region. Qiemo(Qarqan/Cherchen) County. Xikakandasayi, China (254-406 CE)
Proben-ID: C795
China China Xinjiang Xikakandasayi Historical 254-406 calCE Xikakandasayi Culture M13a1b Subklade
KI-generiertes illustratives Porträt von Qinghai Dulan Wayan Reservoir Site Classical individual, Dulan Wayan reservoir site (Dulan County, Reshui town), China (706-883 CE)
Proben-ID: BB2006
China Dulan-Wayan Culture 706-883 calCE (1220±20 BP, LZU-18106) Dulan-Wayan M13a2 Subklade
KI-generiertes illustratives Porträt von Austronesian individual, West Peninsular Kelantan. Gua Cha Cave, Malaysia (744-398 BCE)
Proben-ID: Ma912
Malaysia Malaysia LN 744 BCE - 398 BCE Malaysian Neolithic M13c Subklade
KI-generiertes illustratives Porträt von Malaysia N individual, West Peninsular Kelantan. Gua Cha Cave, Malaysia (744-398 BCE)
Proben-ID: Ma912
Malaysia Neolithic Malaysia 744 BCE - 398 BCE M13c Subklade
KI-generiertes illustratives Porträt von Tibet Longsangquduo individual, Longsangquduo (Shigatse), China (900-1,200 CE)
Proben-ID: C5154
China Tibetan Plateau (Longsangquduo) 900-1200 CE Longsangquduo Culture M13a2 Subklade
KI-generiertes illustratives Porträt von Austroasiatic individual, Man Bac, Vietnam (1,889-1,742 BCE)
Proben-ID: I1859
Vietnam Vietnam N 1889 BCE - 1742 BCE Vietnamese Neolithic M13b Subklade
KI-generiertes illustratives Porträt von Vietnam N individual, Man Bac, Vietnam (1,889-1,742 BCE)
Proben-ID: I1859
Vietnam Vietnam N 1889 BCE - 1742 BCE Vietnamese Neolithic M13b Subklade
MATERNAL LINEAGE · ANCIENT DNA

Ancient lineage evidence map

Follow parent clades toward this branch and explore where ancient carriers were found.

Loading ancient observations…

Markers are archaeological find locations. A dashed connector is an uncertain, proposed geographic transition between consecutive branches supported by multiple dated observations; it is not an exact travel route, birthplace or proof of direct descent. Parent-clade samples may belong to other descendant branches. Gaps remain where evidence is insufficient. Sample dates differ from haplogroup formation dates.

Referenzprofil

Trägerverteilungskarte

Geografische Verteilung von 7 antiken DNA-Proben (direkte und Subkladen-Träger von M13)

Subkladen-Träger
Zeitraumfilter
Alle Zeiträume
Alle Proben werden angezeigt
Referenzprofil

Zeitliche Verteilung

Verteilung der Träger über archäologische Epochen

Referenzprofil

Geografische Verteilung

Anzahlen nach erfasstem Probenland. Sie spiegeln die verfügbare Referenzauswahl wider, nicht Bevölkerungshäufigkeiten.

Referenzprofil

Verteilung Land × Epoche

Vergleichen Sie erfasste Probenanzahlen nach Ländern und archäologischen Epochen. Wählen Sie eine belegte Zelle, um eine Probe anzusehen.

Daten

Daten und Herkunft

Quellenangaben und Datenqualität

Zuletzt aktualisiert 2026-06-14
Konfidenzwert 50/100
Abdeckung Low

Datenquelle

Klassifikation, geschätzte Daten und geografischer Kontext spiegeln die erfassten Referenzdaten wider und können sich bei überarbeiteten Belegen ändern. Die Probenabdeckung ist ungleichmäßig; erfasste Orte und archäologische Zuordnungen begründen weder persönliche Herkunft noch kulturelle Identität.