Aller au contenu principal
mtDNA · lignée Maternelle

T

mtDNA Haplogroup T

Profil de référence pour une branche de lignée. Des haplogroupes partagés n'établissent pas de lien familial ni d'identité culturelle.

Profil de référence

Contexte de la branche

Contexte historique de la branche de lignée mtDNA T

Haplogroup T is a mitochondrial DNA (mtDNA) haplogroup that is maternally inherited and plays a significant role in tracing the maternal ancestry of populations in Europe, the Near East, Central Asia, and North Africa. This haplogroup is a descendant of haplogroup JT, which further branches into haplogroups J and T, with haplogroup T being the focus of migration patterns and genetic studies, especially in relation to the spread of Neolithic farming communities and later historical migrations.

Origin and Evolution

Haplogroup T is believed to have originated approximately 25,000 to 30,000 years ago, likely in the Near East or Western Asia. It is a direct descendant of haplogroup JT, which itself derives from the broader haplogroup R. Haplogroup T’s emergence is closely tied to the Upper Paleolithic period, which saw significant population migrations and cultural developments, as well as to later events such as the Neolithic expansion and migrations during the Bronze Age.

Subclades of Haplogroup T

Haplogroup T is divided into several important subclades, each with distinct geographic distributions and historical significance:

  1. T1: This subclade is primarily found in Europe, the Near East, and North Africa. T1a is the most common subclade, with its presence particularly noted in European populations.

  2. T2: This is the more widespread and diverse subclade of haplogroup T, found across Europe, the Near East, and Central Asia. T2 has numerous sub-branches, indicating ancient migrations and genetic diversification, with significant frequencies in Western and Northern Europe.

Geographic Distribution and Significance

Europe

Haplogroup T is widely distributed across Europe, where it is particularly common in populations in Western, Central, and Northern Europe. Its frequency in Europe likely reflects the migration patterns of early Neolithic farmers, who spread from the Near East into Europe around 9,000 to 7,000 years ago. These early agriculturalists carried haplogroup T, among other lineages, and contributed to the genetic landscape of modern European populations.

  • Western Europe: Haplogroup T is present in countries like France, Germany, and the British Isles, where it has persisted through various historical migrations.
  • Northern Europe: T2 subclades are more common in Scandinavia and surrounding regions, reflecting migration patterns during the Bronze Age and the later Viking expansions.

Near East

Haplogroup T is also common in the Near East, where it likely originated. It is found in populations from Israel, Lebanon, Turkey, and Jordan. The Near East is a critical region for the development of agriculture, and haplogroup T’s presence here reflects its ancient roots in these early farming societies.

The spread of haplogroup T into Europe is closely tied to the movement of Neolithic farming communities from the Near East, particularly through Anatolia and into the Balkans.

Central Asia and North Africa

In Central Asia, haplogroup T is present at lower frequencies, reflecting historical migrations and trade routes that connected Europe, the Near East, and Asia. Its presence in North Africa, particularly in Berber populations, also points to ancient migratory connections between these regions and the Mediterranean basin.

Role in Human Migration

Haplogroup T is significant for understanding the Neolithic expansion, one of the most important migratory events in human history. During the Neolithic period, early farmers from the Near East migrated into Europe, bringing with them domesticated plants and animals, as well as new farming technologies. This migration, which took place around 9,000 to 7,000 years ago, had a profound impact on the genetic makeup of European populations, and haplogroup T played a key role in this process.

Later migrations, such as those during the Bronze Age and subsequent historical periods, likely contributed to the further spread of haplogroup T across Europe and into Central Asia and North Africa. The movement of peoples along ancient trade routes, such as the Silk Road, may have also facilitated the dispersal of haplogroup T into more distant regions.

Ancient DNA and Archaeological Evidence

Ancient DNA studies have identified haplogroup T in several prehistoric human remains from Neolithic and Bronze Age archaeological sites in Europe and the Near East. These findings provide direct evidence of haplogroup T’s role in the migration of early farming communities into Europe.

  • In Neolithic Europe, haplogroup T has been detected in early farming populations, particularly in Central Europe, the British Isles, and Scandinavia.
  • In the Near East, ancient DNA from early farming sites in Turkey and Israel has revealed the presence of haplogroup T, further supporting the theory that this haplogroup originated in the Near East and spread into Europe with the advent of agriculture.

Modern Distribution and Frequency

Haplogroup T is found at varying frequencies in modern populations, particularly in Europe, the Near East, and North Africa:

  • In Western and Central Europe, haplogroup T accounts for around 10% of maternal lineages, with higher frequencies in certain regions such as the British Isles and Germany.
  • In the Near East, haplogroup T is present in significant frequencies, particularly in Israel, Lebanon, and Turkey.
  • In North Africa, haplogroup T is found at lower frequencies, particularly in Berber populations, indicating ancient connections with the Mediterranean and Europe.

Genetic and Evolutionary Significance

Haplogroup T is significant for understanding the genetic history of Europe, the Near East, and North Africa. Its wide distribution and evolutionary history make it a key marker for studying ancient human migrations, particularly those associated with the Neolithic expansion and later migrations during the Bronze Age.

As one of the maternal lineages associated with the spread of farming communities from the Near East into Europe, haplogroup T reflects the complex genetic and cultural exchanges that shaped the early development of European societies. Its presence in both ancient and modern populations highlights its role in the genetic diversity of these regions.

Conclusion

Haplogroup T is a mitochondrial DNA lineage with deep historical roots in the Near East and a wide distribution across Europe, North Africa, and Central Asia. Originating around 25,000 to 30,000 years ago, haplogroup T played a significant role in the Neolithic expansion, when early agriculturalists migrated from the Near East into Europe, bringing with them farming practices that transformed human societies.

Today, haplogroup T is found at moderate frequencies in modern populations across these regions, reflecting the long-standing genetic and cultural connections between Europe, the Near East, and North Africa. As a key maternal lineage, haplogroup T continues to be a focus of research in population genetics and archaeology, providing valuable insights into the migration and adaptation of ancient human populations.

Points clés

  • Origin and Evolution
  • Subclades of Haplogroup T
  • Geographic Distribution and Significance
  • Role in Human Migration
  • Ancient DNA and Archaeological Evidence

Profil de référence

Arbre et relations

Contexte phylogénétique et sous-clades

Voie évolutive

Suivez les branches parentes consignées jusqu'à T. Les dates sont des estimations et peuvent évoluer lorsque les données de référence sont révisées.

Étapes Haplogroupe Âge estimé Époque archéologique Temps écoulé Descendants immédiats Descendants modernes testés Liens anciens
1 T Actuel ~27,000 years ago Paleolithic 27,000 ans 3 1,950 84
2 JT ~40,000 years ago Paleolithic 40,000 ans 2 4,094 1
3 R2'JT - - - 2 4,133 0
4 R ~55,000 years ago Paleolithic 55,000 ans 17 22,830 57
5 NA - - - 1 22,830 0
6 N ~60,000 years ago Paleolithic 60,000 ans 16 26,150 13
7 L3 ~70,000 years ago Paleolithic 70,000 ans 7 30,162 6
8 L3'4 - - - 2 30,212 0
9 L3'4'6 - - - 2 30,216 0
10 L2'3'4'6 - - - 2 31,333 0
11 L2'3'4'5'6'7 - - - 2 31,349 0
12 L1'2'3'4'5'6'7 - - - 2 31,852 0
13 L ~160,000 years ago Paleolithic 160,000 ans 2 32,236 5

Branches sœurs (1)

Autres branches issues du même haplogroupe parent

Profil de référence

Dans le monde

Distribution géographique et présence moderne

Origine consignée

The Near East, with significant dispersal into Europe and parts of Central Asia

Distribution moderne

MTDNA haplogroup T is primarily found in the following populations:

  • European populations (especially in Southern, Central, and Eastern Europe)
  • Middle Eastern populations
  • Caucasus region populations
  • Some populations in North Africa
  • Jewish populations, particularly Ashkenazi Jews
  • Some populations in Central Asia
Contexte historique

Une branche dans le temps

Formation estimée sur une chronologie historique large. Les repères de période servent de contexte et n'impliquent pas de lien avec des cultures particulières.

  1. Il y a ~27k ans

    Haplogroupe T

    Formation estimée de cette branche mtDNA ; les dates et les lieux sont des estimations de référence.

    Cette branche
  2. Il y a ~20k ans

    Dernier maximum glaciaire

    Apogée de la dernière période glaciaire, populations isolées

  3. Il y a ~10k ans

    Révolution néolithique

    Début de l'agriculture et émergence de communautés sédentaires

  4. Il y a ~5k ans

    Âge du bronze

    Travail des métaux, écriture et premières civilisations

  5. Il y a ~3k ans

    Âge du fer

    Outils en fer, réseaux d'échanges élargis

  6. Il y a ~2.5k ans

    Antiquité classique

    Floraison des civilisations grecque et romaine

  7. Aujourd'hui

    Aujourd'hui

    Époque moderne

Profil de référence

Contexte archéologique

Associations archéologiques consignées pour la branche mtDNA T

Associations consignées

Ces libellés décrivent des contextes archéologiques consignés pour des échantillons de référence liés à T. Une association n'établit pas que tous les porteurs appartenaient à une culture ni qu'ils ont suivi une route migratoire précise.

Bulgarian EBA Dali Culture Early Medieval Armenian Frälsegården Ghassulian Gonur Culture Kanai Kokcha Linear Pottery Culture Russia_Kalmykia_EMBA_Yamnaya Welsh Neolithic
Les attributions culturelles reposent sur le contexte archéologique des échantillons d'ADN ancien et peuvent refléter des associations régionales à certaines périodes.
Profil de référence

Catalogue d'échantillons

18 porteurs directs et 66 porteurs de sous-clade de l'haplogroupe T

10 affiché(s) · 50 échantillons correspondants

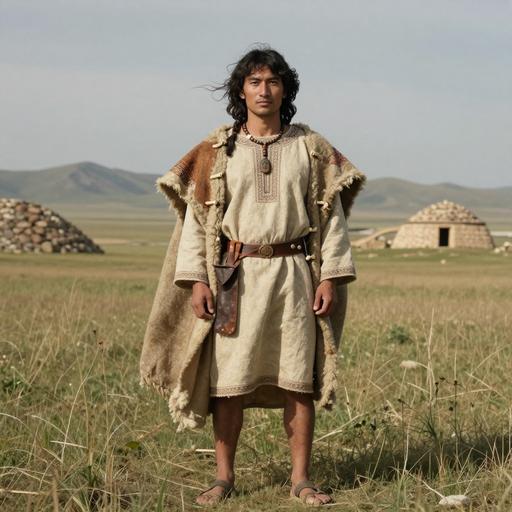
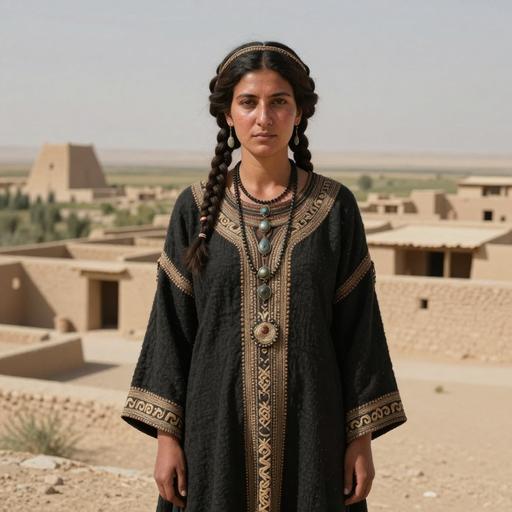
Les portraits sont des illustrations générées par IA. Les libellés d'échantillon et identifiants d'accès désignent les enregistrements de référence.

Portrait Échantillon Pays Époque Date Culture mtDNA Correspondance
Portrait illustratif généré par IA de Lazio Imperial Roman Roman individual, ANAS (Azienda Nazionale Autonoma delle Strada), Italy (100-300 CE)
Identifiant d'échantillon : R72
Italy Imperial Rome 100-300 CE Roman Empire T Direct
Portrait illustratif généré par IA de IA Wielbark individual, Masłomęcz (Lublin Province, Hrubieszów County, Hrubieszów), Poland (328-431 CE)
Identifiant d'échantillon : PCA0093
Poland Wielbark Culture 328-431 calCE Wielbark T Direct
Portrait illustratif généré par IA de Grand Est Haut Rhin IA individual, Oberes Holzackerfeld / Echangeur Gendarmerie (2005) (Grand Est Region, Haut-Rhin Department, Colmar arrondissement, Sainte Croix en Plaine), France (450-1 BCE)
Identifiant d'échantillon : SCPG2
France Iron Age Haut-Rhin Culture 450-1 BCE Haut-Rhin Culture T Direct
Portrait illustratif généré par IA de Avar-o Low East Asia individual, Kunszállás-Fülöpjakab (Bács-Kiskun County, Kecskemét), Hungary (580-804 CE)
Identifiant d'échantillon : KFJ046
Hungary Hungary Avar 550-850 CE Avar T Direct
Portrait illustratif généré par IA de Late Avar-o High East Asia individual, Rákóczifalva-Bagi-földek (Jász-Nagykun-Szolnok Coiunty, Szolnok), Hungary (650-900 CE)
Identifiant d'échantillon : RKF166
Hungary Hungary LateAvar 650-900 CE Avar Culture T Direct
Portrait illustratif généré par IA de Early Medieval Slav individual, Santok (Lubusz Province, Gorzów Wielkopolski, Santok), Poland (1,000-1,200 CE)
Identifiant d'échantillon : PCA0391
Poland Iron Age Santok Culture 1000-1200 CE Santok Culture T Direct
Portrait illustratif généré par IA de Agarak Town Stadium Medieval individual, Agarak, Armenia (1,100-1,300 CE)
Identifiant d'échantillon : I1660
Armenia Early Medieval Armenia 1100-1300 CE Early Medieval Armenian T Direct
Portrait illustratif généré par IA de BA individual, Kokcha 3, Uzbekistan (1,741-1,613 BCE)
Identifiant d'échantillon : I8506
Uzbekistan Bronze Age Kokcha 1741-1613 calBCE (3375±20 BP, PSUAMS-5275) Kokcha T Direct
Portrait illustratif généré par IA de MLBA individual, Byan Zherek. eastern spur. Dali, Kazakhstan (1,900-1,600 BCE)
Identifiant d'échantillon : I3448
Kazakhstan Mid-Late Bronze Dali 1900-1600 BCE Dali Culture T Direct
Portrait illustratif généré par IA de BA1-1 individual, Gonur, Turkmenistan (2,195-2,027 BCE)
Identifiant d'échantillon : I1793
Turkmenistan Bronze Age Gonur 2195-2027 calBCE (3700±20 BP, PSUAMS-2312) Gonur Culture T Direct
LIGNÉE MATERNELLE · ADN ANTIQUE

Carte des preuves de lignées antiques

Suivez les clades parents jusqu'à cette branche et explorez où des porteurs antiques ont été identifiés.

Chargement des observations antiques…

Les marqueurs indiquent des lieux de découvertes archéologiques. Un trait pointillé représente une transition géographique proposée et incertaine entre branches consécutives, appuyée sur plusieurs observations datées ; ce n'est pas un itinéraire exact, un lieu de naissance ni une preuve de descendance directe. Des échantillons de clades parents peuvent appartenir à d'autres branches descendantes. Des lacunes subsistent lorsque les preuves sont insuffisantes. Les dates d'échantillon diffèrent des dates de formation des haplogroupes.

Profil de référence

Carte de répartition des porteurs

Répartition géographique de 84 échantillons d'ADN ancien (porteurs directs et de sous-clade de T)

Porteur direct Porteur de sous-clade
Filtre de période
Toutes les périodes
Affichage de tous les échantillons
Profil de référence

Répartition temporelle

Répartition des porteurs selon les périodes archéologiques

Profil de référence

Répartition géographique

Effectifs par pays d'échantillon consigné. Ils reflètent la sélection de référence disponible, pas des fréquences de population.

Profil de référence

Répartition pays × époque

Comparez les effectifs d'échantillons consignés selon les pays et les périodes archéologiques. Sélectionnez une cellule renseignée pour examiner un échantillon.

Données

Données et provenance

Informations sur les sources et qualité des données

Dernière mise à jour 2026-01-15

Source des données

La classification, les dates estimées et le contexte géographique reflètent les données de référence consignées et peuvent évoluer lorsque les éléments sont révisés. La couverture d'échantillons est inégale ; les lieux consignés et les associations archéologiques n'établissent pas une origine personnelle ni une identité culturelle.