


Admixture Studio lets you analyze selected segments of a target RAW file. This can help you compare how a chosen model describes those segments, including boundaries listed in another service's composition file.
Prepare a segment template
Create a plain-text template in Notepad using the chromosome, start point and end point columns.
Chromosome,Start Point,End Point
7,32000000,43000000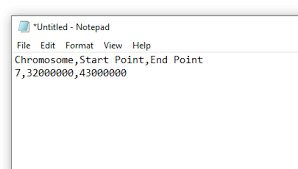
Paste and review the boundaries
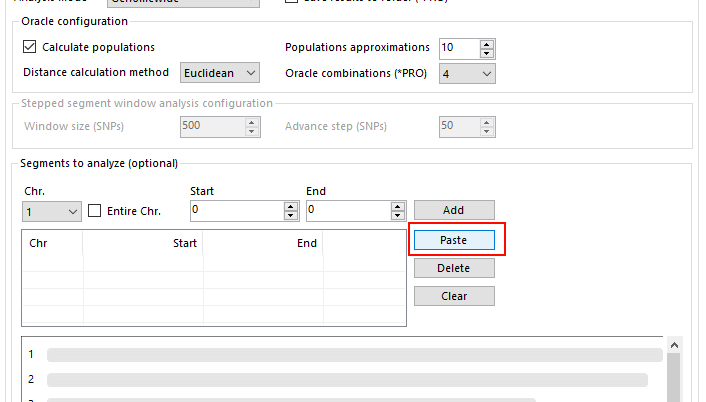
Copy the template and use the Paste button in the Segment to Analyze panel. Review the segments that are added before continuing.
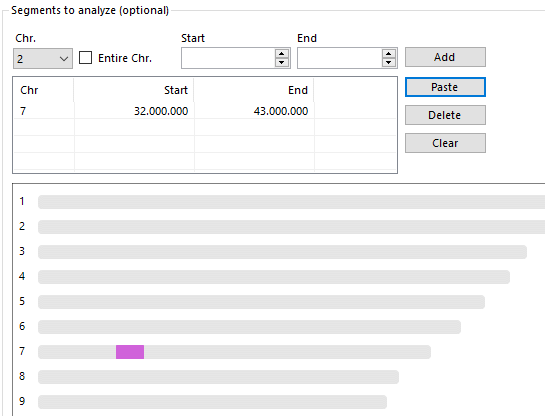
Run the selected calculator
After completing your selection, run the calculator in Genomewide mode on the target RAW file. Review the output in the result window alongside the selected method, settings and references.
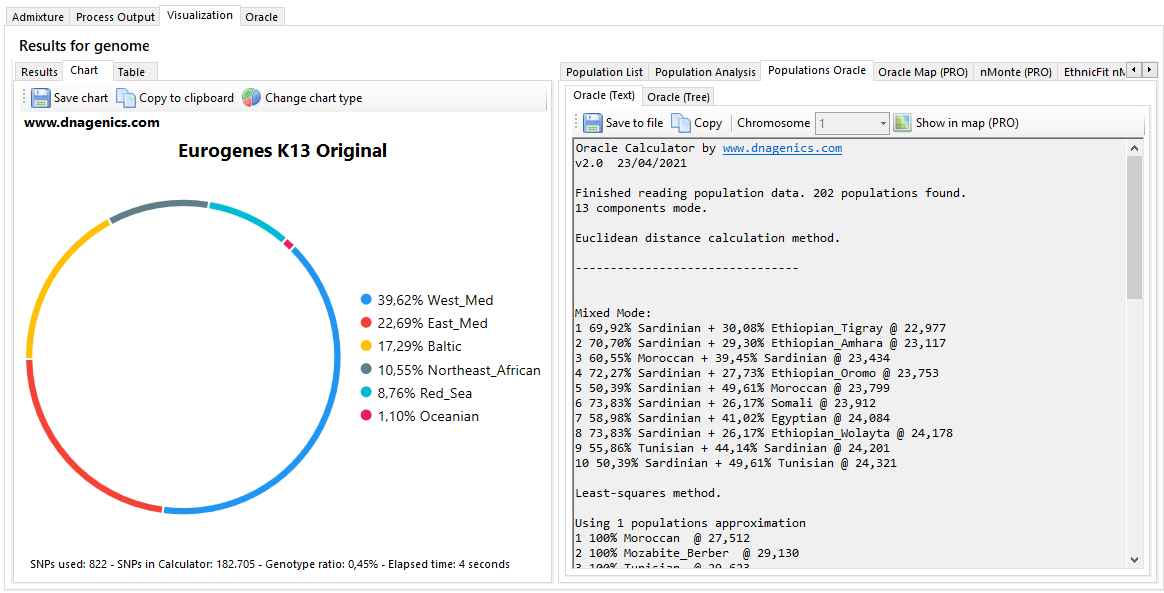
A different calculator or reference panel can give a different view of the same segments. A comparison is not independent verification of a genealogical conclusion.
23andMe Ancestry Composition CSV
If you already have a compatible composition export, copy the segments to analyze into a new plain-text file. Add this header as its first line:
Ancestry,Copy,Chromosome,Start Point,End PointThe example below shows the expected column structure. Check the current export's labels and coordinate conventions before using your own data.
Ancestry,Copy,Chromosome,Start Point,End Point
Northwestern European,2,chr6,120583383,170919470
Northwestern European,1,chr7,127233279,142841959
Northwestern European,1,chr7,145109518,146814694
Northwestern European,1,chr7,148036377,149542524
Northwestern European,2,chr12,3155321,95931927
Run the selected calculator on the target RAW file, then review its output in the results page. Provider export formats and application interfaces can change; these screenshots document the workflow shown in this guide.