Menu
mtDNA Haplogroup • Maternal Lineage

L0D1B2

mtDNA Haplogroup L0D1B2

~20,000 years ago
Southern Africa
1 subclades
Scroll to explore
Chapter I

The Story

The journey of mtDNA haplogroup L0D1B2

Origins and Evolution

mtDNA haplogroup L0D1B2 is a downstream clade of L0d1b, itself part of the ancient L0d family that represents some of the deepest maternal lineages in anatomically modern humans. The parent clade L0d1b has been dated to the Late Pleistocene in southern Africa; L0D1B2 likely arose after the main divergence of L0d1b but still represents a Pleistocene or early Holocene lineage (here estimated ~20 kya based on phylogenetic position and available coalescent estimates for related L0d subclades). L0d lineages in general are characterized by long-term persistence within foraging groups of southern Africa and by deep internal structure reflecting long regional continuity.

L0D1B2 is defined by downstream mutations that distinguish it from other L0d1b branches; however, the substructure of L0D1B2 is less well sampled in published datasets than some higher‑frequency African haplogroups, so many finer-scale splits may remain undocumented until larger whole‑mitogenome surveys of southern African populations are conducted.

Subclades

At present, L0D1B2 is treated as a discrete subclade of L0d1b. Published datasets and public sequence repositories indicate limited internal diversity sampled to date, suggesting either a historically low effective population size for this branch or undersampling of geographically isolated groups (notably Khoe‑San communities). Future targeted mitogenome sequencing of diverse Khoe‑San and neighboring groups may reveal additional sublineages (e.g., L0D1B2a/b) and help refine its coalescence time and demographic history.

Geographical Distribution

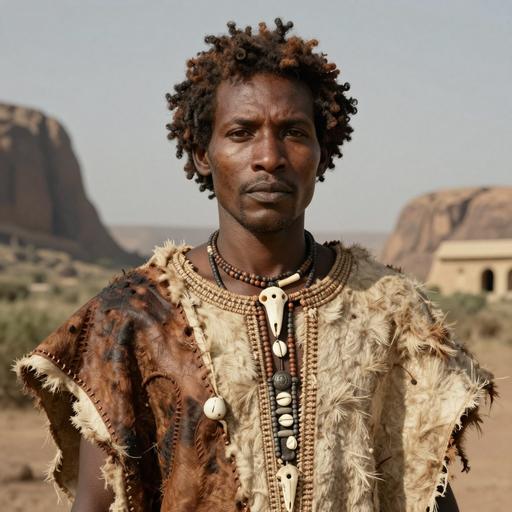
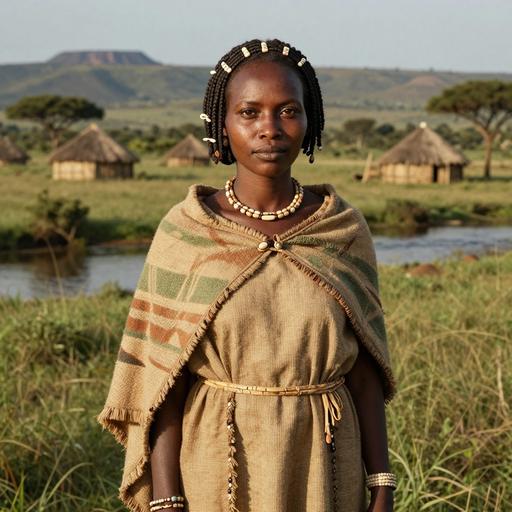
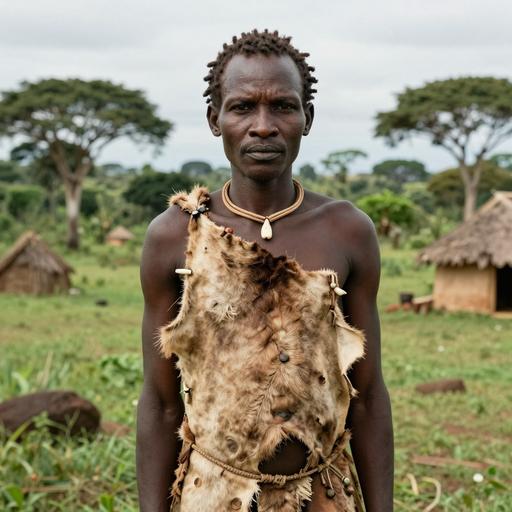
Primary concentration: southern Africa, particularly among Khoe‑San forager and forager‑pastoral populations (for example Ju|'hoan, !Kung, Nama and related groups).

Secondary occurrences: low‑to‑moderate frequency detections in neighboring Bantu‑speaking populations of southern Africa resulting from historic and prehistorical admixture, and isolated low‑frequency occurrences reported in parts of East and Central Africa. Due to the transatlantic slave trade and later migrations, rare instances of L0d1b‑derived lineages appear in African‑descended populations in the Americas, though L0D1B2 specifically is uncommon outside southern Africa.

Overall, the geographic pattern of L0D1B2 is consistent with an origin and long persistence in southern African foraging populations with limited, asymmetric gene flow into neighboring groups during the Holocene.

Historical and Cultural Significance

L0D1B2 contributes to the genetic signature used to identify deep maternal continuity among Khoe‑San groups and to distinguish ancient southern African matrilineal lineages from those associated with later incoming populations (e.g., Bantu‑speaking agriculturalists). The presence of L0D1B2 and related L0d lineages in low frequencies among Bantu and other neighboring groups documents episodes of admixture between resident forager communities and expanding populations during the Holocene, including the Iron Age and Bantu expansions.

Because mtDNA is maternally inherited and does not recombine, L0D1B2 is particularly informative for reconstructing maternal demographic events — such as continuity, isolation, and sex‑specific admixture — in southern Africa over the Late Pleistocene and Holocene.

Conclusion

L0D1B2 is an informative, regionally concentrated maternal lineage that exemplifies the deep genetic heritage of southern African forager populations. While currently sampled at modest frequencies, targeted mitogenome sequencing in underrepresented Khoe‑San and neighboring communities will likely refine the haplogroup's internal structure, age estimates, and finer geographic patterning, further illuminating southern Africa's ancient maternal demographic history.

Key Points

  • Origins and Evolution
  • Subclades
  • Geographical Distribution
  • Historical and Cultural Significance
  • Conclusion
Chapter II

Tree & Relationships

Phylogenetic context and subclades

Evolution Path

This haplogroup's evolutionary journey from its earliest ancestor to the present.

Steps Haplogroup Age Estimate Archaeology Era Time Passed Immediate Descendants Tested Modern Descendants Ancient Connections
1 L0D1B2 Current ~20,000 years ago 🏹 Mesolithic 20,000 years 1 0 0
2 L0D1B ~45,000 years ago 🦴 Paleolithic 45,000 years 1 2 0
3 L0D1 ~70,000 years ago 🦴 Paleolithic 70,000 years 3 7 0
4 L0d ~120,000 years ago 🦴 Paleolithic 120,000 years 3 21 4
5 L0 ~170,000 years ago 🦴 Paleolithic 170,000 years 4 245 6
6 L ~160,000 years ago 🦴 Paleolithic 160,000 years 7 18,987 5
Chapter III

Where in the World

Geographic distribution and modern presence

Place of Origin

Southern Africa

Modern Distribution

The populations where mtDNA haplogroup L0D1B2 is found include:

  1. Khoe-San groups of southern Africa (e.g., Ju|'hoan, !Kung, Nama)
  2. Various southern African Bantu-speaking populations (low-to-moderate frequency due to admixture)
  3. Some East African populations at low-to-moderate frequencies (reflecting ancient and historic contacts)
  4. Central African forager groups (low frequency)
  5. African-descended populations in the Americas (rare, due to the transatlantic slave trade)
  6. Occasional low-frequency occurrences in North Africa and the Near East (historical admixture)
CHAPTER IV

When in Time

Your haplogroup in the context of human history

~20k years ago

Last Glacial Maximum

Peak of the last ice age, populations isolated

~20k years ago

Haplogroup L0D1B2

Your mtDNA haplogroup emerged in Southern Africa

Southern Africa
~10k years ago

Neolithic Revolution

Agriculture begins, settled communities form

~5k years ago

Bronze Age

Metalworking, writing, and early civilizations

~3k years ago

Iron Age

Iron tools, expanded trade networks

~2k years ago

Classical Antiquity

Greek and Roman civilizations flourish

Present

Present Day

Modern era

Your Haplogroup
Historical Era
Chapter IV-B

Linked Cultures

Ancient cultures associated with mtDNA haplogroup L0D1B2

Cultural Heritage

These ancient cultures have been linked to haplogroup L0D1B2 based on matching ancient DNA samples from archaeological excavations. The presence of this haplogroup in these cultures provides insights into the migrations and population movements of populations carrying this haplogroup.

Fingira Culture Late Iron Age Makwasinyi Malawian LSA Middle Iron Age Mtwapa Tanzanian Prehistoric Terminal Stone Age Zambian LSA
Culture assignments are based on archaeological context of ancient DNA samples and may represent regional associations during specific time periods.
Chapter V

Sample Catalog

5 subclade carriers of haplogroup L0D1B2 (no exact L0D1B2 samples sequenced yet)

5 / 5 samples
Portrait Sample Country Era Date Culture mtDNA Match
Portrait of ancient individual UCT386 from South Africa, dated 88 BCE - 202 BCE
UCT386
South Africa South Africa 1900 Years Before Present 88 BCE - 202 BCE Middle Iron Age L0d1b2b1b Downstream
Portrait of ancient individual UCT386 from South Africa, dated 88 BCE - 202 BCE
UCT386
South Africa Ancient South Africa 88 BCE - 202 BCE L0d1b2b1b Downstream
Portrait of ancient individual I10726 from Zambia, dated 3333 BCE - 2932 BCE
I10726
Zambia Late Stone Age Zambia 3333 BCE - 2932 BCE Zambian LSA L0d1b2b Downstream
Portrait of ancient individual I4427 from Malawi, dated 4227 BCE - 3965 BCE
I4427
Malawi Late Stone Age Malawi 4227 BCE - 3965 BCE Malawian LSA L0d1b2b Downstream
Portrait of ancient individual I4427 from Malawi, dated 4227 BCE - 3965 BCE
I4427
Malawi Ancient East Africa 4227 BCE - 3965 BCE L0d1b2b Downstream
Chapter VI

Carrier Distribution Map

Geographic distribution of 5 ancient DNA samples (direct and subclade carriers of L0D1B2)

Subclade carrier
Time Period Filter
All Time Periods
Showing all samples
Chapter VII

Temporal Distribution

Distribution of carriers across archaeological periods

Chapter VIII

Geographic Distribution

Distribution by country of origin (direct and subclade carriers shown by default)

Chapter IX

Country × Era Distribution

Cross-tabulation of carrier countries and archaeological periods (direct and subclade carriers shown by default)

Data

Data & Provenance

Source information and data quality

Last Updated 2026-02-16
Confidence Score 50/100
Coverage Low
Data Source

We use the latest phylotree for MTDNA haplogroup classification and data.