Menu
Currency
mtDNA Haplogroup • Maternal Lineage

N1

mtDNA Haplogroup N1

~45,000 years ago
Near East / Western Eurasia
3 subclades
21 ancient samples
Scroll to explore
Chapter I

The Story

The journey of mtDNA haplogroup N1

Origins and Evolution

Haplogroup N1 derives from the broader macro-haplogroup N through an intermediate node often represented as N1'5. Macro-haplogroup N arose shortly after the out-of-Africa expansion and N1 represents a regional diversification within western Eurasia and the Near East during the Upper Paleolithic (tens of thousands of years ago). Genetic dating places the coalescence of N1 on the order of several tens of thousands of years ago (a reasonable central estimate ~40–50 kya), consistent with early post-glacial or Late Upper Paleolithic population structure across the Near East and adjoining regions.

Subclades

N1 has several well-characterized downstream lineages. The two most prominent are:

  • N1a: Best known from ancient DNA studies for its elevated frequency among early Neolithic farmers in Central and Northern Europe (the so-called Early European Farmer signal). N1a has multiple sub-branches, some of which are rare in modern Europe but detectable in ancient Neolithic contexts.
  • N1b: Found primarily in the Near East and adjacent regions, with sublineages present in the Caucasus, the Levant, and also detected at low frequencies in Jewish and Mediterranean populations.

Other minor subclades and regional variants exist and new branches continue to be resolved as more complete mtDNA genomes are sequenced. Because N1 sits relatively deep in the tree, some branches reflect very ancient population structure while others record later demographic events.

Geographical Distribution

Modern occurrences of N1 and its subclades are patchy but geographically broad, reflecting a long history of movement and population turnover. Key features of its distribution are:

  • Near East / Anatolia: A principal area of diversification and persistence, with multiple subclades present at low-to-moderate frequencies.
  • Europe: Detected both in ancient Neolithic samples (especially N1a among early farmers) and at low frequencies in modern Southern, Central and Western European populations.
  • North Africa and the Horn of Africa: Low-frequency occurrences are consistent with both ancient backflows from Eurasia into Africa and later historic contacts across the Mediterranean and Red Sea.
  • Caucasus: Several localized N1 variants appear in Caucasus populations, reflecting regional continuity and gene flow.

The overall picture is of a lineage that is not overwhelmingly common in any single modern population but is significant for the insight it provides into Paleolithic and Neolithic demographic processes.

Historical and Cultural Significance

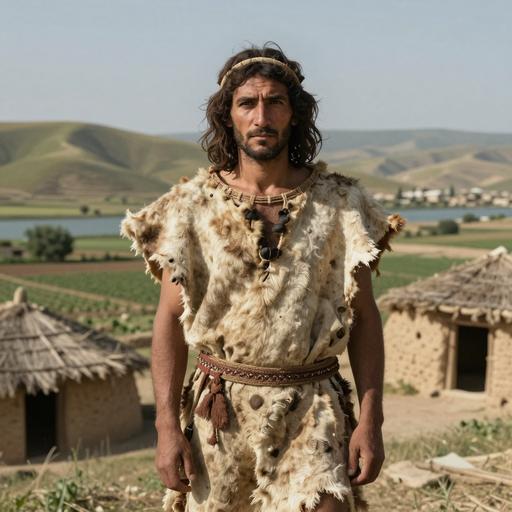
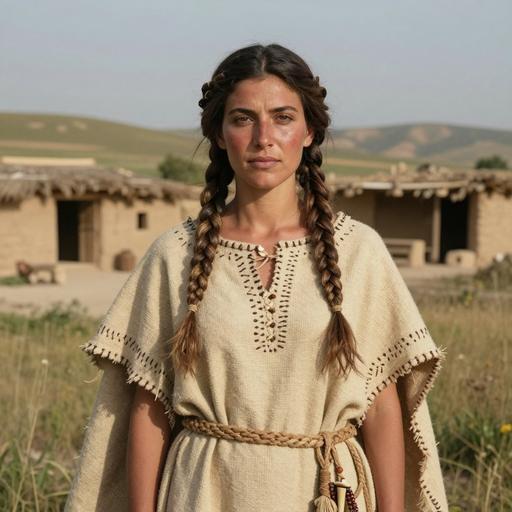
Haplogroup N1 is important in population genetics primarily because of its association with major prehistoric demographic events rather than because of very high modern frequencies. The most notable cultural association is with Early Neolithic farmer communities in Europe, where ancient DNA has shown elevated proportions of N1a among early Linearbandkeramik (LBK) and other early farming groups — a pattern interpreted as part of the demographic spread of agriculture from the Near East into Europe. Other subclades (for example N1b) are more characteristic of the Near East and adjacent regions and appear in historical and modern populations across the eastern Mediterranean and Caucasus.

Because N1 lineages are found in both Eurasia and parts of Africa, they also inform discussions of prehistoric back-migration into North and East Africa and of historical movements (trade, migrations, and diaspora communities) that redistributed maternal lineages across the Mediterranean and Red Sea.

Conclusion

mtDNA haplogroup N1 is a Western-Eurasian/Near Eastern maternal lineage that dates to the Upper Paleolithic and has given rise to daughter clades that were important in later Neolithic and historical population dynamics. It is a useful marker in ancient DNA and modern population studies for tracing the spread of agriculture into Europe, Near Eastern population structure, and later interregional contacts linking Europe, the Near East, North Africa and the Horn of Africa. Continued sequencing of complete mitochondrial genomes and targeted ancient DNA sampling will refine the branching pattern, dates, and geographic details of N1 and its subclades.

Key Points

  • Origins and Evolution
  • Subclades
  • Geographical Distribution
  • Historical and Cultural Significance
  • Conclusion
Chapter II

Tree & Relationships

Phylogenetic context and subclades

Evolution Path

This haplogroup's evolutionary journey from its earliest ancestor to the present.

Steps Haplogroup Age Estimate Archaeology Era Time Passed Immediate Descendants Tested Modern Descendants Ancient Connections
1 N1 Current ~45,000 years ago 🦴 Paleolithic 45,000 years 3 662 21
2 N1'5 2 690 0
3 N ~60,000 years ago 🦴 Paleolithic 60,000 years 16 20,371 13
4 L3 ~70,000 years ago 🦴 Paleolithic 70,000 years 7 23,542 6
5 L3'4 2 23,581 0
6 L3'4'6 2 23,584 0
7 L2'3'4'6 2 24,475 0
8 L2'3'4'5'6'7 2 24,488 0
9 L1'2'3'4'5'6'7 2 24,903 0
10 L ~160,000 years ago 🦴 Paleolithic 160,000 years 2 25,205 5

Siblings (1)

Other branches from the same parent haplogroup

Chapter III

Where in the World

Geographic distribution and modern presence

Place of Origin

Near East / Western Eurasia

Modern Distribution

The populations where mtDNA haplogroup N1 is found include:

  1. Near Eastern and Anatolian populations (Levantine Arabs, Turks, Kurds)
  2. Southern European populations (Italians, Iberians, Greeks)
  3. Central and Northern European early farmer contexts (LBK-associated ancient samples)
  4. North African populations (Maghreb and coastal North Africa, low frequencies)
  5. Horn of Africa populations (Ethiopia, Somalia — low-frequency lineages reflecting Eurasian backflow)
  6. Caucasus populations (Armenians, Georgians and neighboring groups)
  7. Jewish communities (certain Sephardi and some Ashkenazi lineages exhibit N1/N1b subclades)
CHAPTER IV

When in Time

Your haplogroup in the context of human history

~50k years ago

Upper Paleolithic

Advanced tool-making, art, and cultural explosion

~45k years ago

Haplogroup N1

Your mtDNA haplogroup emerged in Near East / Western Eurasia

Near East / Western Eurasia
~20k years ago

Last Glacial Maximum

Peak of the last ice age, populations isolated

~10k years ago

Neolithic Revolution

Agriculture begins, settled communities form

~5k years ago

Bronze Age

Metalworking, writing, and early civilizations

~3k years ago

Iron Age

Iron tools, expanded trade networks

~2k years ago

Classical Antiquity

Greek and Roman civilizations flourish

Present

Present Day

Modern era

Your Haplogroup
Historical Era
Chapter IV-B

Linked Cultures

Ancient cultures associated with mtDNA haplogroup N1

Cultural Heritage

These ancient cultures have been linked to haplogroup N1 based on matching ancient DNA samples from archaeological excavations. The presence of this haplogroup in these cultures provides insights into the migrations and population movements of populations carrying this haplogroup.

Bohemian Hunter-Gatherer Buran-Kaya Corded Ware Dzudzuana Early Avar Early Bronze Anatolia Funnel Beaker Culture Iraqi PPN Lingolsheim Culture Natufian Peștera cu Oase
Culture assignments are based on archaeological context of ancient DNA samples and may represent regional associations during specific time periods.
Chapter V

Sample Catalog

21 subclade carriers of haplogroup N1 (no exact N1 samples sequenced yet)

21 / 21 samples
Portrait Sample Country Era Date Culture mtDNA Match
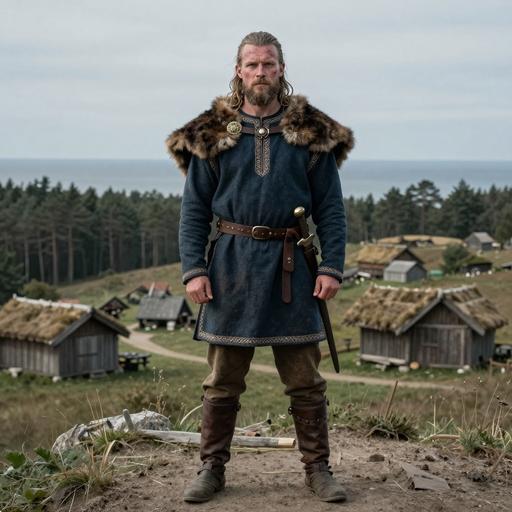
Portrait of ancient individual VK473 from Sweden, dated 900 CE - 1050 CE
VK473
Sweden Viking Age Sweden 900 CE - 1050 CE Viking N1a1a1a1 Downstream
Portrait of ancient individual VK473 from Sweden, dated 900 CE - 1050 CE
VK473
Sweden The Viking Age 900 CE - 1050 CE N1a1a1a1* Downstream
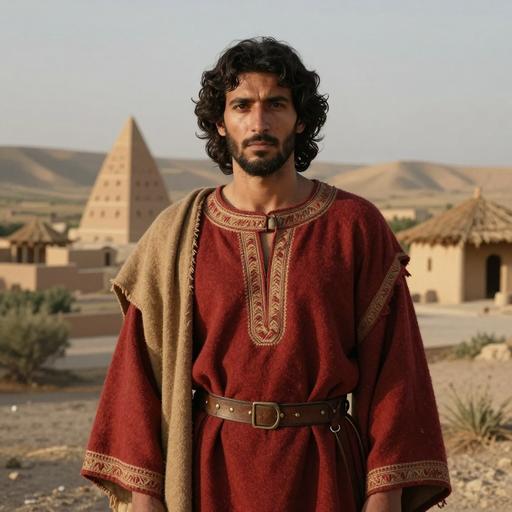
Portrait of ancient individual F38 from Iran, dated 971 BCE - 828 BCE
F38
Iran The Iron Age in Hasanlu, Iran 971 BCE - 828 BCE Hasanlu Culture N1a3a Downstream
Portrait of ancient individual F38 from Iran, dated 971 BCE - 828 BCE
F38
Iran Iron Age Iran 971 BCE - 828 BCE N1a3a* Downstream
Portrait of ancient individual VK324 from Denmark, dated 978 CE - 1120 CE
VK324
Denmark Viking Age Denmark 978 CE - 1120 CE Viking Denmark N1a1a1a2a Downstream
Portrait of ancient individual VK324 from Denmark, dated 978 CE - 1120 CE
VK324
Denmark The Viking Age 978 CE - 1120 CE N1a1a1a2a* Downstream
Portrait of ancient individual ERS1790733 from Lebanon, dated 1950 BCE - 1692 BCE
ERS1790733
Lebanon Middle Bronze Age Lebanon 1950 BCE - 1692 BCE Lebanese Bronze Age N1a3a11 Downstream
Portrait of ancient individual ERS1790733 from Lebanon, dated 1950 BCE - 1692 BCE
ERS1790733
Lebanon Bronze Age Levant 1950 BCE - 1692 BCE N1a3a11* Downstream
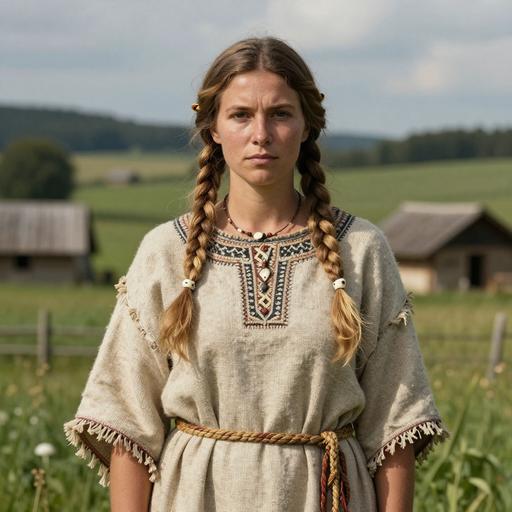
Portrait of ancient individual ZEL001 from Czech Republic, dated 2500 BCE - 2300 BCE
ZEL001
Czech Republic Corded Ware Culture, Bohemia, Czech Republic 2500 BCE - 2300 BCE Corded Ware N1'5 Downstream
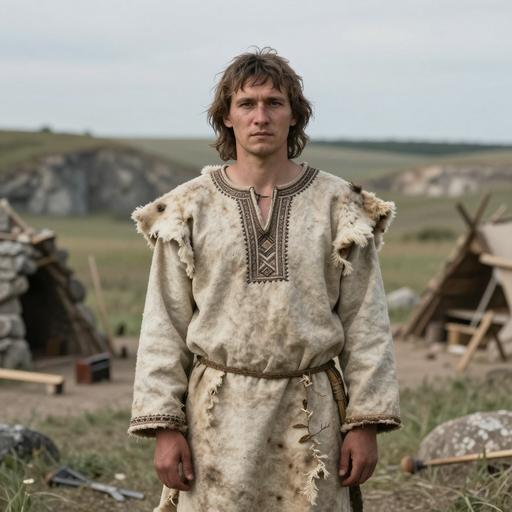
Portrait of ancient individual HAL001 from Russia, dated 2830 BCE - 2468 BCE
HAL001
Russia Fatyanovo Culture 2830 BCE - 2468 BCE Fatyanovo N1a1a1a2a Downstream
Chapter VI

Carrier Distribution Map

Geographic distribution of 21 ancient DNA samples (direct and subclade carriers of N1)

Subclade carrier
Time Period Filter
All Time Periods
Showing all samples
Chapter VII

Temporal Distribution

Distribution of carriers across archaeological periods

Chapter VIII

Geographic Distribution

Distribution by country of origin (direct and subclade carriers shown by default)

Chapter IX

Country × Era Distribution

Cross-tabulation of carrier countries and archaeological periods (direct and subclade carriers shown by default)

Data

Data & Provenance

Source information and data quality

Last Updated 2026-06-14
Confidence Score 50/100
Coverage Low
Data Source

We use the latest phylotree for MTDNA haplogroup classification and data.